SC-Elephant DB Server allows analysis of RamData objects hosted on the web, including K-BDS (Korea Bio Data Station), GitHub Page, or Amazon AWS S3, enabling the exploration of extremely large single cell datasets without the use of memory-intensive server-side applications (like that of cellxgene or Shiny-based applications).
What is SC-Elephant.js?
SC-Elephant.js is a JavaScript implementation of SC-Elephant (Single-Cell Extremely Large Data Analysis Platform), a Python package for the analysis of extremely large single-cell data in a very memory-efficient manner. SC-Elephant.js allows analysis of RamData in a web browser, increasing the accessibility of a single-cell data.
1) Load RamData
SC-Elephant.py generates a RamData object for the analysis of a single-cell data matrix.
The resulting RamData object, once uploaded to the GitHub Page (or any web location with CORS enabled), can be analyzed by SC-Elephant.py or .js. Here, using SC-Elephant.js, a RamData object can be visualized and explored.
2) Retrieve AnnData
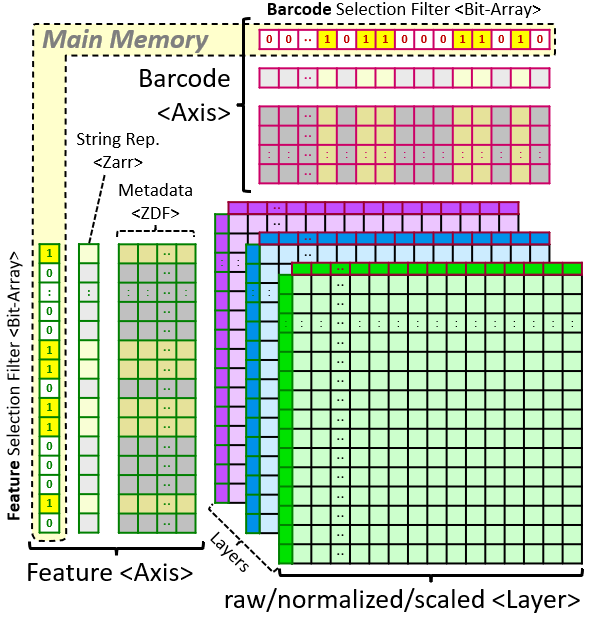
A RamData object is composed of two RamDataAxis (Axis) objects and multiple RamDataLayer (Layer) objects.
The two RamDataAxis objects, 'Barcode' and 'Feature' objects, use 'filter' to select cells (barcodes) and genes (features) before retrieving data from the RamData object, respectively.
3) Plot AnnData
Once an AnnData object (a single-cell data container, like the AnnData object of SCANPY) is retrieved, various plots can be drawn, including the Scatter, Violin, and Dot plots.
Feature : a UMAP plot visualizing gene expression
Annotation : a UMAP plot visualizing cell annotations
Both : both Feature and Annotation UMAP plots with synced layouts
Violin : a violine plot visualizing expression of a single gene
Dot : a dot plot visualizing expression of multiple genes
Cloud : word cloud settings for exploring cell annotations
For the scatter plots (Feature, Annotation, or Both), by selecting the cells using the lasso tool (available in the toolbar on the upper right side of the graph), raw counts of the selected cells can be downloaded for the downstream analysis (also powered by SC-Elephant.js).
General Settings
Keyboard Shortcuts
Settings
Alt + s - show / hide the general settings modal
Alt + a - activate / deactivate the advanced mode
SC-Elephant Panels
Alt + q - show / hide 1) Load RamData panel
Alt + w - show / hide 2) Retrieve AnnData panel
Alt + e - show / hide 3) Plot AnnData panel
Plotting
Alt + r - draw a graph using the settings, equivalent to clicking button.
Miscellaneous
Ctrl + i - show / hide the introduction modal
Alt + k - show / hide the keyboard shortcut modal (this modal)